
A factor lens on portfolio construction and diversification
Investment factors provide a useful framework for understanding the various sources of return within an equity portfolio. Value, quality, momentum, low volatility and dividend yield are among the most widely recognized, although definitions and construction can vary across index providers. For this analysis, we use S&P factor indexes to provide a consistent basis for comparison.
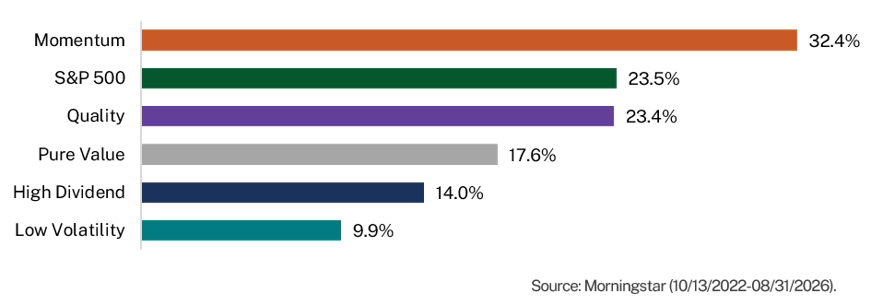
Momentum has been one of the best-performing factors in recent years, rewarding investors with exposure to the market's strongest recent performers. Since the S&P 500 bottomed in October 2022, the S&P 500 Momentum Index has returned 32.4% annualized, compared with 23.5% for the S&P 500. Quality has largely kept pace with the broader market, while Pure Value, High Dividend and Low Volatility have lagged by considerably wider margins.
Momentum Has Led the Major U.S. Equity Factors
(Annualized Total Return)
Momentum's influence has also extended well beyond dedicated factor-based investing. The S&P 500, one of the most widely followed benchmarks for U.S. equities, is weighted by market capitalization. As stock prices rise, those companies become larger portions of the index. When market leadership is sustained, investors' core equity exposure can therefore become increasingly influenced by many of the same companies, industries and return drivers favored by a Momentum strategy, even without an explicit allocation to Momentum.
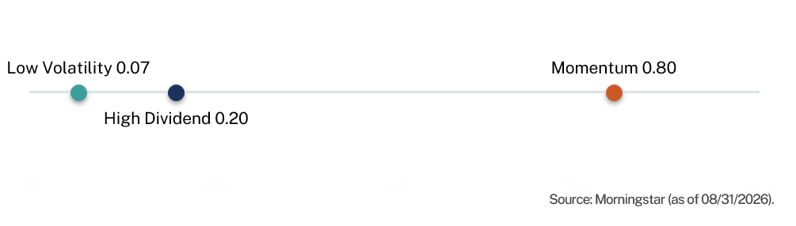
That relationship has become particularly pronounced recently. As of August 31, 2026, the trailing one-year correlation between the S&P 500 and the S&P 500 Momentum Index was 0.80. Correlations with High Dividend and Low Volatility were considerably lower at 0.20 and 0.07, respectively.
Momentum Has Become Closely Tied to the Broad Market
(Trailing 1-year correlation to the S&P 500)
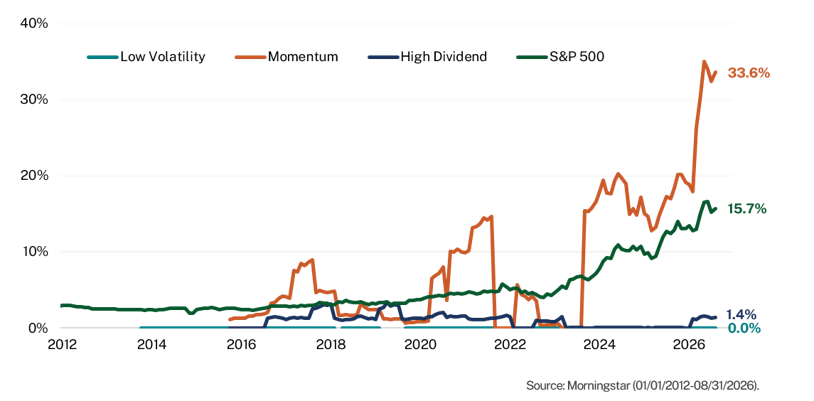
The overlap between Momentum and the broader market has become more consequential as the S&P 500 has grown increasingly concentrated. As of August 31, 2026, the ten largest companies accounted for 37.8% of the index. Semiconductor companies provide one example of the shared return drivers. Beneficiaries of the AI buildout have grown into larger portions of both the Momentum Index and the S&P 500, while High Dividend and Low Volatility have maintained considerably less semiconductor exposure.
Semiconductor Exposure Highlights Different Return Drivers
(Semiconductor Industry Weight)
Investors can own several U.S. equity strategies and still have much of their performance influenced by the same underlying companies and industries. Portfolio diversification therefore depends on more than the number of strategies an investor owns; the underlying sources of return matter as well. As common return drivers become more prominent, the characteristics of the strategies held alongside them become increasingly important.
Among widely recognized equity factors, High Dividend and Low Volatility have historically provided meaningful differentiation from Momentum. Momentum favors stocks with the strongest recent price trends, while Low Volatility generally emphasizes stocks with more stable price behavior and High Dividend favors companies offering relatively high dividend yields. These characteristics can result in meaningfully different sector exposures and return patterns over time.
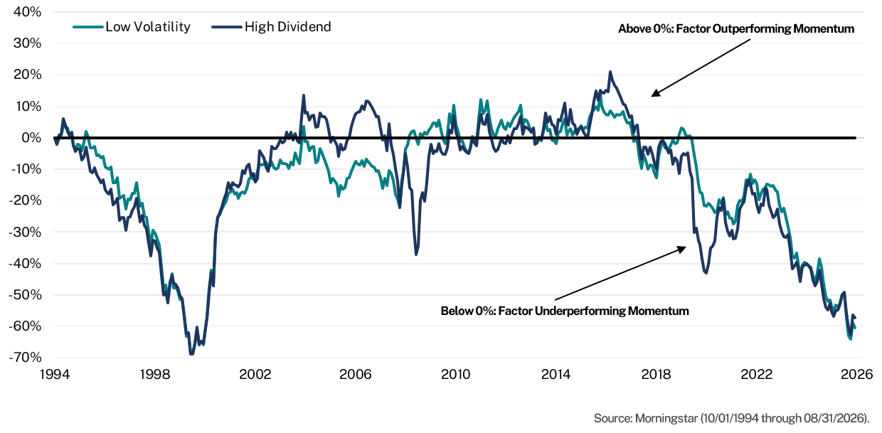
The late 1990s provide the most dramatic example, as Momentum's substantial relative advantage during the technology boom reversed sharply in the years that followed. Similar shifts in leadership have occurred several times since.
High Dividend and Low Volatility Have Experienced Long Cycles Relative to Momentum
(Cumulative excess return of High Dividend and Low Volatility vs. Momentum)
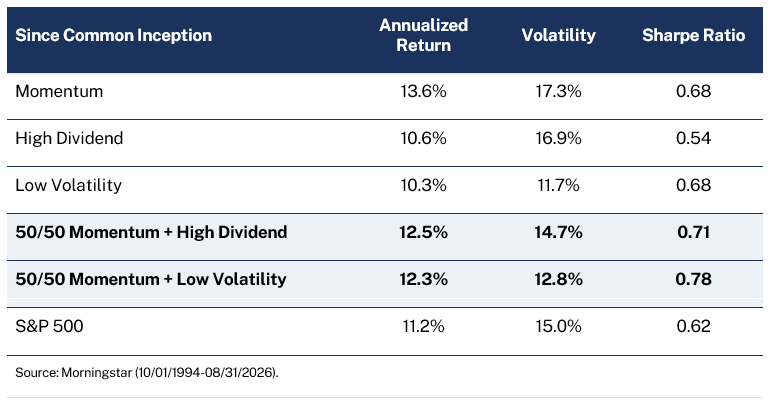
Those differences in return patterns have also historically provided diversification benefits when the factors are combined. Since 1994, hypothetical 50/50 combinations of Momentum with either High Dividend or Low Volatility generated higher Sharpe ratios than Momentum and the S&P 500, while retaining much of Momentum's long-term return.
Complementary Factors Have Historically Improved Risk-Adjusted Results
Portfolio Implications
Momentum has been an important source of U.S. equity returns over the past several years, and its influence has extended beyond dedicated Momentum strategies. The S&P 500 has become highly correlated with the factor as recent winners have grown into larger portions of the index, with the AI buildout and semiconductor leadership contributing to that trend.
Momentum's recent leadership could persist, particularly if the trends supporting today's market leaders remain intact. The portfolio consideration is the degree to which equity exposure has become increasingly dependent on a common set of return drivers. Long-term factor performance provides useful perspective for portfolio construction. Momentum, High Dividend and Low Volatility have experienced very different periods of relative strength and weakness. Combining these different sources of return has historically retained much of Momentum's return while reducing volatility and improving risk-adjusted results.
For investors, the current environment may warrant greater attention to equity strategies with return drivers that differ from Momentum and the broader market. Low Volatility and High Dividend are two factor examples, while more broadly constructed active equity strategies focused on other sources of return, including income, may offer additional diversification benefits. As the broad market has become more influenced by a concentrated group of recent winners, these types of strategies can help diversify the underlying sources of return within a U.S. equity allocation.
Morningstar, Inc. is a global investment research firm providing data, information, and analysis of stocks and mutual funds. © Morningstar, Inc. 2026. All Rights Reserved. The information contained herein: (1) is proprietary to Morningstar and/or its content providers; (2) may not be copied, adapted or distributed; and (3) is not warranted to be accurate, complete or timely. Neither Morningstar nor its content providers are responsible for any damages or losses arising from any use of this information, except where such damages or losses cannot be limited or excluded by law in your jurisdiction. Past financial performance is no guarantee of future results.
The S&P 500 Total Return Index is an unmanaged, capitalization-weighted measure comprised of 500 leading U.S. companies to gauge U.S. large cap equities. The S&P 500 Momentum Total Return Index is designed to measure the performance of securities in the S&P 500 that exhibit persistence in their relative performance. The S&P 500 Quality Total Return Index is designed to measure the performance of securities in the S&P 500 that exhibit the strongest quality characteristics based on return on equity, accruals ratio, and financial leverage ratio. The S&P 500 Pure Value Total Return Index measures the performance of securities in the S&P 500 that exhibit strong value characteristics based on book value-to-price, earnings-to-price, and sales-to-price ratios, with constituents weighted by their value scores. The S&P 500 Low Volatility Total Return Index is designed to measure the performance of the 100 least volatile stocks in the S&P 500, with constituents weighted by the inverse of their volatility. The S&P 500 High Dividend Total Return Index is designed to measure the performance of 80 high-yield companies within the S&P 500 and is equally weighted to best represent the performance of this group, regardless of constituent size. Index returns do not reflect any fees or expenses. You cannot invest directly in an index. The indexes account for the reinvestment of regular cash dividends, but not for the withholding of taxes. Index returns provided by Morningstar, Inc. Index data referenced herein is the property of S&P Dow Jones Indices LLC, a division of S&P Global Inc., its affiliates (“S&P”) and/or its third-party suppliers and has been licensed for use by Manning & Napier. S&P and its third-party suppliers accept no liability in connection with its use. Data provided is not a representation or warranty, express or implied, as to the ability of any index to accurately represent the asset class or market sector that it purports to represent and none of these parties shall have any liability for any errors, omissions, or interruptions of any index or the data included therein. For additional disclosure information, please see: https://go.manning-napier.com/benchmark-provisions.
The hypothetical 50/50 factor combinations shown are for illustrative purposes only and do not represent the performance of an actual investment or portfolio. The combinations assume an equal allocation to each specified index and monthly rebalancing. Index returns do not reflect investment management fees, transaction costs, or other expenses. Hypothetical results have inherent limitations and should not be considered indicative of actual or future performance.
Past performance does not guarantee future results.