
Economic Cycle
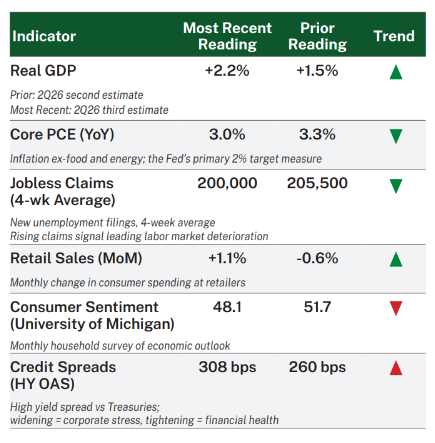
The U.S. economy continued to demonstrate resilience in September, with signs of strength across both businesses and consumers. Second-quarter real GDP growth was revised higher to 2.2%, while more recent measures of business activity strengthened across both manufacturing and services. Business investment also remained an important source of growth, supported in part by continued spending on AI
Consumer spending has remained healthy despite more modest income growth, as households have reduced savings to support spending. Labor market conditions also remain relatively stable, with unemployment claims remaining low. At the same time, inflation remains elevated and above the Federal Reserve’s 2% target, while higher energy prices have added to near-term inflation pressures. Against this backdrop of resilient economic growth and persistent inflation, the Federal Reserve raised interest rates by 0.25 percentage points in September, its first rate increase in more than three years.
Equity Markets
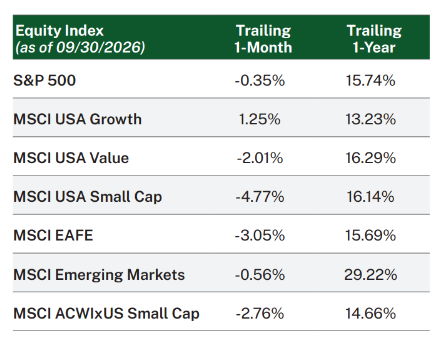
U.S. equities weakened modestly in September, although the relatively small decline in the S&P 500 masked considerably greater weakness beneath the surface. Market leadership remained concentrated, with several mega-cap technology companies benefiting from continued enthusiasm surrounding AI investment and helping support the broader index.
Most sectors finished the month lower, with Information Technology and Communication Services the only two sectors to post positive returns. Higher interest rates also weighed on more rate-sensitive areas of the market, including Real Estate and Utilities, while smaller companies experienced more pronounced declines. Within technology, semiconductors and other companies tied closely to the AI infrastructure buildout were particularly strong. International equities also declined during the month, with a stronger U.S. dollar creating an additional headwind for U.S. investors.
Fixed Income Markets
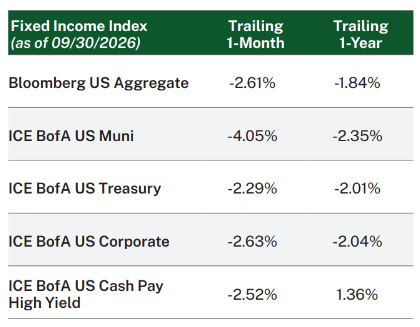
Fixed income markets came under significant pressure in September as Treasury yields rose sharply across the yield curve. Resilient economic growth and persistent inflation contributed to a significant repricing of interest-rate expectations, while the Federal Reserve raised its policy rate for the first time in more than three years. The largest increases occurred in the intermediate portion of the curve, although yields moved meaningfully higher across maturities.
The broad rise in rates weighed on nearly all areas of the bond market. Municipal bonds were particularly weak as the increase in Treasury yields was compounded by unfavorable supply and demand dynamics and tax-related selling. Credit spreads also widened during the month, adding another source of pressure for corporate bonds, while short-term securities were comparatively resilient.
Our Perspective
Equity markets remain near record highs, supported by resilient economic growth, healthy corporate earnings, and continued investment in AI. At the same time, the continued rise in interest rates is becoming an increasingly important consideration for investors. Higher bond yields have improved the relative attractiveness of fixed income while also raising the hurdle for equities, particularly in more interest-rate-sensitive areas of the market.
We continue to believe this environment favors a balanced approach. AI remains a significant long-term investment opportunity, but the concentration of market returns tied to the theme also creates risks. Historically, periods of narrow market leadership have reinforced the importance of diversification. As the opportunity set evolves, we believe investors should remain focused on whether they are being adequately compensated for the risks they assume while avoiding excessive reliance on any single source of return.
Monthly Recommendation
In Chip War, economic historian Chris Miller traces the remarkable story of the semiconductor, from its origins in Silicon Valley to its role today as one of the most strategically important technologies in the world. Miller explores how a handful of companies and countries came to dominate chip design and manufacturing, and how that concentration has shaped global supply chains, economic competition, and geopolitics. Named the Financial Times Business Book of the Year, Chip War offers advisors valuable context for understanding the forces behind artificial intelligence, the evolving relationship between the US and China, and the technology that powers nearly everything we use.
Indicator Sources: Bureau of Economic Analysis (BEA) — Real GDP estimate & Core PCE (bea.gov / fred.stlouisfed.org) | Department of Labor (DOL) Jobless Claims (fred.stlouisfed.org) | Census Bureau Retail Sales (census.gov) | University of Michigan Surveys of Consumers (sca.isr.umich.edu) | ICE BofA High Yield Option-Adjusted Spread (OAS) (fred.stlouisfed.org).
Index Disclosures: Unless otherwise noted, index returns do not reflect any fees or expenses and are provided by Morningstar, Inc. Index data referenced herein is the property of each index sponsor (S&P Dow Jones Indices LLC, a division of S&P Global Inc. (“S&P”), Bloomberg Finance L.P. (“Bloomberg”), ICE Data Indices, LLC (“ICE Data”), and MSCI), their affiliates (“Index Sponsors”) and/or their third-party suppliers and has been licensed for use by Manning & Napier. The Index Sponsors and their third-party suppliers accept no liability in connection with its use. Data provided is not a representation or warranty, express or implied, as to the ability of any index to accurately represent the asset class or market sector that it purports to represent and none of these parties shall have any liability for any errors, omissions, or interruptions of any index or the data included therein. For additional disclosure information, please see: https://go.manning-napier.com/benchmark-provisions. See next page for index definitions.
All investments contain risk and may lose value. This material contains the opinions of Manning & Napier, which are subject to change based on evolving market and economic conditions. This material has been distributed for informational purposes only and should not be considered as investment advice or a recommendation of any particular security, strategy or investment product. Information contained herein has been obtained from sources believed to be reliable but not guaranteed.
The S&P 500 Total Return Index is an unmanaged, capitalization-weighted measure comprised of 500 leading U.S. companies to gauge U.S. large cap equities. The index accounts for the reinvestment of regular cash dividends, but not for the withholding of taxes. The MSCI USA Value Index is designed to measure large and mid-cap US securities exhibiting overall value style characteristics. The MSCI USA Growth Index is designed to measure large and mid-cap US securities exhibiting overall growth style characteristics. The MSCI USA Small Cap Index is designed to measure the performance of the small cap segment of the US equity market. The index represents approximately 14% of the free float-adjusted market capitalization in the US. The MSCI EAFE Index is a free float-adjusted market capitalization index designed to measure large and mid-cap representation across 21 Developed Markets countries (excluding the U.S. and Canada). The MSCI Emerging Markets Index is a free float-adjusted market capitalization index that is designed to measure equity market performance of emerging markets and consists of 24 emerging market country indices outside the U.S. The MSCI ACWI ex USA Small Cap Index is designed to measure a small cap representation across 22 of 23 Developed Markets countries (excluding the U.S.) and 24 Emerging Markets countries. MSCI indices are denominated in U.S. dollars, returns are net of withholding taxes, and they assume daily reinvestment of net dividends thus accounting for any applicable dividend taxation. The Bloomberg U.S. Aggregate Bond Index is an unmanaged, market-value weighted index of U.S. domestic investment- grade debt issues, including government, corporate, asset-backed, and mortgage-backed securities, with maturities of one year or more. Index returns provided by Intercontinental Exchange (ICE). The ICE Bank of America (BofA) U.S. Municipal Securities Index tracks the performance of U.S. dollar denominated investment grade tax-exempt debt publicly issued by U.S. states, territories, and their political subdivisions. Qualifying securities must have at least one year remaining term to final maturity, at least 18 months to final maturity at the time of issuance, a fixed coupon schedule and an investment grade rating. The ICE BofA U.S. Treasury Total Return Index is an unmanaged index that measures the performance of U.S. dollar-denominated, fixed-rate securities issued by the U.S. Treasury across all maturities. The ICE BofA U.S. Corporate Total Return Index is an unmanaged index that measures the performance of U.S. dollar-denominated, investment-grade, fixed-rate corporate debt publicly issued in the U.S. domestic market. The ICE BofA U.S. Cash Pay High Yield Index tracks the performance of U.S. dollar denominated below investment grade corporate debt, currently in a coupon paying period, issued in the U.S. domestic market. Qualifying securities must have at least one year remaining term to final maturity as of the rebalancing date, at least 18 months to final maturity at the time of issuance, a fixed coupon schedule, and a minimum amount outstanding of $250 million.
Morningstar, Inc. is a global investment research firm providing data, information, and analysis of stocks and mutual funds. © Morningstar, Inc. 2026. All Rights Reserved. The information contained herein: (1) is proprietary to Morningstar and/or its content providers; (2) may not be copied, adapted or distributed; and (3) is not warranted to be accurate, complete or timely. Neither Morningstar nor its content providers are responsible for any damages or losses arising from any use of this information, except where such damages or losses cannot be limited or excluded by law in your jurisdiction. Past financial performance is no guarantee of future results.