
Economic Cycle
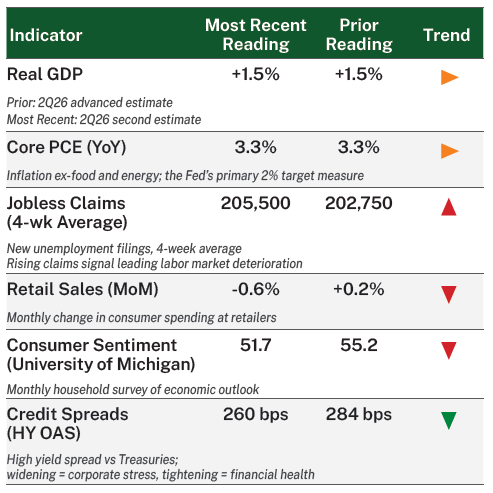
The U.S. economy continued to expand, supported by relatively healthy private-sector demand. Business investment remained an important source of growth, driven in part by continued spending on AI infrastructure, while household income continued to grow and the labor market remained relatively stable. Consumer indicators were more mixed, with retail sales and consumer sentiment weakening in the latest readings.
Inflation remains stubbornly elevated, complicating the outlook for monetary policy. While some measures have moderated, the Federal Reserve’s preferred core inflation measure remained above its 2% target, and higher energy prices have added uncertainty to the near-term outlook. For now, continued capital investment and a stable labor market remain supportive of the expansion, even as persistent inflation and mixed consumer indicators complicate the outlook.
Equity Markets
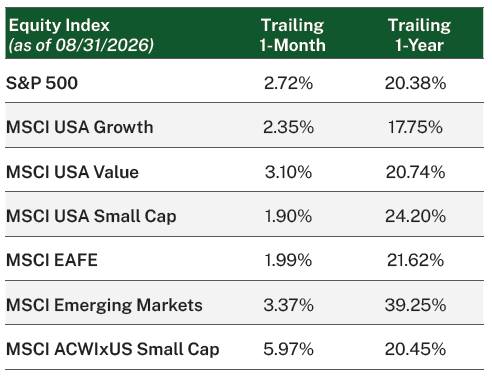
U.S. equities continued to advance in August, with the S&P 500 reaching new highs during the month. Large cap stocks generally maintained their advantage over smaller companies, while international equities also moved higher, led by emerging markets.
Information Technology was an important contributor to U.S. market gains, with software stocks among the strongest performers. Several companies that had come under pressure earlier this year amid concerns that artificial intelligence could disrupt traditional software business models rebounded sharply as earnings helped ease some of those fears. Energy also performed strongly alongside higher oil prices. Outside the U.S., emerging markets benefited from strength across parts of Asia, where continued demand for semiconductors and other AI-related hardware supported export growth and equity markets in several technology-heavy economies.
Fixed Income Markets
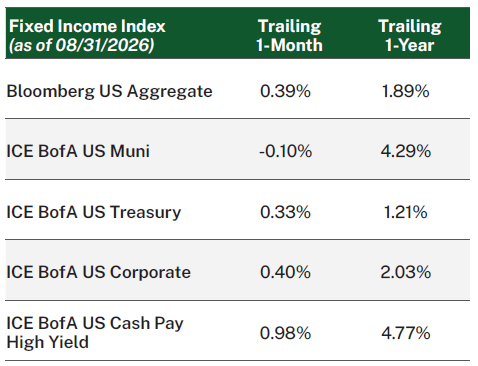
Fixed income markets were mixed in August as investors navigated persistent inflation and volatility in Treasury yields. Longer-term yields moved higher at points during the month as elevated government borrowing, heavy corporate issuance tied in part to the AI and data center buildout, and rising global yields increased pressure on long-duration bonds. Those moves later reversed, leaving Treasury yields relatively unchanged for the month.
Against that backdrop, fixed income returns were generally modest, with income providing the primary source of return. High yield bonds outperformed as credit spreads tightened further, while investment grade spreads were roughly unchanged. Corporate fundamentals remain supportive, but historically tight spreads leave investors with relatively little additional compensation for taking credit risk, reinforcing the importance of selectivity.
Our Perspective
Equity markets remain near record highs, supported by resilient economic growth, healthy corporate earnings, and continued investment in AI. Beneath the surface, however, performance across individual companies and industries has become increasingly differentiated as investors assess which businesses stand to benefit from the AI buildout and which may face disruption.
We continue to believe this environment favors a balanced approach. AI represents a significant long-term investment opportunity, but the scale of recent investment and the concentration of market returns tied to the theme also create risks. Maintaining exposure to potential beneficiaries while remaining diversified across companies, sectors, and areas of the market less dependent on the AI investment cycle can provide a more durable foundation for long-term returns.
Monthly Recommendation
In Believing Is Seeing, Dr. Kevin Elko and Rev. Duane Thompson explore how changing the way we think can change the way we approach challenges, opportunities, and life itself. Dr. Elko and Rev. Thompson draw on their decades of experience helping individuals and teams perform at their best to offer practical takeaways for developing positivity, purpose, and resiliency. For anyone seeking an approachable take on motivation and personal growth, Believing is Seeing serves as a powerful reminder of what we can achieve through focus and intention.
Indicator Sources: Bureau of Economic Analysis (BEA) — Real GDP estimate & Core PCE (bea.gov / fred.stlouisfed.org) | Department of Labor (DOL) Jobless Claims (fred.stlouisfed.org) | Census Bureau Retail Sales (census.gov) | University of Michigan Surveys of Consumers (sca.isr.umich.edu) | ICE BofA High Yield Option-Adjusted Spread (OAS) (fred.stlouisfed.org).
Index Disclosures: Unless otherwise noted, index returns do not reflect any fees or expenses and are provided by Morningstar, Inc. Index data referenced herein is the property of each index sponsor (S&P Dow Jones Indices LLC, a division of S&P Global Inc. (“S&P”), Bloomberg Finance L.P. (“Bloomberg”), ICE Data Indices, LLC (“ICE Data”), and MSCI), their affiliates (“Index Sponsors”) and/or their third-party suppliers and has been licensed for use by Manning & Napier. The Index Sponsors and their third-party suppliers accept no liability in connection with its use. Data provided is not a representation or warranty, express or implied, as to the ability of any index to accurately represent the asset class or market sector that it purports to represent and none of these parties shall have any liability for any errors, omissions, or interruptions of any index or the data included therein. For additional disclosure information, please see: https://go.manning-napier.com/benchmark-provisions. See next page for index definitions.
All investments contain risk and may lose value. This material contains the opinions of Manning & Napier, which are subject to change based on evolving market and economic conditions. This material has been distributed for informational purposes only and should not be considered as investment advice or a recommendation of any particular security, strategy or investment product. Information contained herein has been obtained from sources believed to be reliable but not guaranteed.
The S&P 500 Total Return Index is an unmanaged, capitalization-weighted measure comprised of 500 leading U.S. companies to gauge U.S. large cap equities. The index accounts for the reinvestment of regular cash dividends, but not for the withholding of taxes. The MSCI USA Value Index is designed to measure large and mid-cap US securities exhibiting overall value style characteristics. The MSCI USA Growth Index is designed to measure large and mid-cap US securities exhibiting overall growth style characteristics. The MSCI USA Small Cap Index is designed to measure the performance of the small cap segment of the US equity market. The index represents approximately 14% of the free float-adjusted market capitalization in the US. The MSCI EAFE Index is a free float-adjusted market capitalization index designed to measure large and mid-cap representation across 21 Developed Markets countries (excluding the U.S. and Canada). The MSCI Emerging Markets Index is a free float-adjusted market capitalization index that is designed to measure equity market performance of emerging markets and consists of 24 emerging market country indices outside the U.S. The MSCI ACWI ex USA Small Cap Index is designed to measure a small cap representation across 22 of 23 Developed Markets countries (excluding the U.S.) and 24 Emerging Markets countries. MSCI indices are denominated in U.S. dollars, returns are net of withholding taxes, and they assume daily reinvestment of net dividends thus accounting for any applicable dividend taxation. The Bloomberg U.S. Aggregate Bond Index is an unmanaged, market-value weighted index of U.S. domestic investment- grade debt issues, including government, corporate, asset-backed, and mortgage-backed securities, with maturities of one year or more. Index returns provided by Intercontinental Exchange (ICE). The ICE Bank of America (BofA) U.S. Municipal Securities Index tracks the performance of U.S. dollar denominated investment grade tax-exempt debt publicly issued by U.S. states, territories, and their political subdivisions. Qualifying securities must have at least one year remaining term to final maturity, at least 18 months to final maturity at the time of issuance, a fixed coupon schedule and an investment grade rating. The ICE BofA U.S. Treasury Total Return Index is an unmanaged index that measures the performance of U.S. dollar-denominated, fixed-rate securities issued by the U.S. Treasury across all maturities. The ICE BofA U.S. Corporate Total Return Index is an unmanaged index that measures the performance of U.S. dollar-denominated, investment-grade, fixed-rate corporate debt publicly issued in the U.S. domestic market. The ICE BofA U.S. Cash Pay High Yield Index tracks the performance of U.S. dollar denominated below investment grade corporate debt, currently in a coupon paying period, issued in the U.S. domestic market. Qualifying securities must have at least one year remaining term to final maturity as of the rebalancing date, at least 18 months to final maturity at the time of issuance, a fixed coupon schedule, and a minimum amount outstanding of $250 million.
Morningstar, Inc. is a global investment research firm providing data, information, and analysis of stocks and mutual funds. © Morningstar, Inc. 2026. All Rights Reserved. The information contained herein: (1) is proprietary to Morningstar and/or its content providers; (2) may not be copied, adapted or distributed; and (3) is not warranted to be accurate, complete or timely. Neither Morningstar nor its content providers are responsible for any damages or losses arising from any use of this information, except where such damages or losses cannot be limited or excluded by law in your jurisdiction. Past financial performance is no guarantee of future results.